
Difference between revisions of "JTAG debugging with Explore LPC1768 using Keil"
| (9 intermediate revisions by 2 users not shown) | |||
| Line 1: | Line 1: | ||
| − | + | [[category:LPC1768 Tutorials]] | |
| − | [[ | + | |
| − | + | ||
This is a quick tutorial on how to setup and use a JTAG debugger with ARM Cortex M3 Microcontroller. I will be using the following, however the flow and setup would be same if you're using anything else. | This is a quick tutorial on how to setup and use a JTAG debugger with ARM Cortex M3 Microcontroller. I will be using the following, however the flow and setup would be same if you're using anything else. | ||
* Debbuger: Real View ULINK 2 | * Debbuger: Real View ULINK 2 | ||
| Line 22: | Line 20: | ||
Now, with the few settings on the Software I should be ready to go. | Now, with the few settings on the Software I should be ready to go. | ||
<gallery mode ="packed-overlay"> | <gallery mode ="packed-overlay"> | ||
| − | File:ARM JTAG | + | File:ARM JTAG 1.jpg|Did not power up |
| − | File:ARM JTAG | + | File:ARM JTAG 2.jpg|External Power |
</gallery> | </gallery> | ||
| + | |||
==Selecting the Debugger== | ==Selecting the Debugger== | ||
*Go to Projects -> Options for Target (ALT + F7) | *Go to Projects -> Options for Target (ALT + F7) | ||
| Line 38: | Line 37: | ||
*Start the debugger | *Start the debugger | ||
*Use various options from the 'Debug' menu to step into the code. | *Use various options from the 'Debug' menu to step into the code. | ||
| + | |||
| + | {{DISQUS}} | ||
Latest revision as of 11:30, 10 August 2016
This is a quick tutorial on how to setup and use a JTAG debugger with ARM Cortex M3 Microcontroller. I will be using the following, however the flow and setup would be same if you're using anything else.
- Debbuger: Real View ULINK 2
- Controller/Board: LPC1768/ Explore Cortex M3
- IDE/Compiler: Keil
JTAG as you know, can be used to program and debug the controller. It can come in pretty handy, if your working on huge chunk of code. It can be used to set up break points and step, through the code.
The Explore ARM Cortex M3 (LPC1768), has a ARM 20 pin JTAG connector as shown in the in the figure below.
Connecting the Hardware
 .
.
I had thought, connecting the debugger to the board, should power it up. However, it does not. Connect a external power adapter to the board.
Once you've the hardware setup, which is really easy. Lets turn our attention to software. Initially, I had thought of trying it out with some open source IDE out there, but I wanted to make it quick, as one of our customers was waiting to use it. Hence thought, let me get it working with Kiel first.
I powered up the board, plugged in the debugger to the board and its USB to my computer. I was waiting to install the drivers, which it never asked. Then found out that it uses USB HID, hence no driver installation required. Now, with the few settings on the Software I should be ready to go.

Did not power up
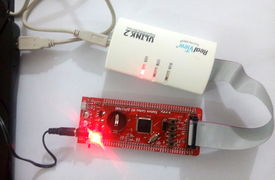
External Power
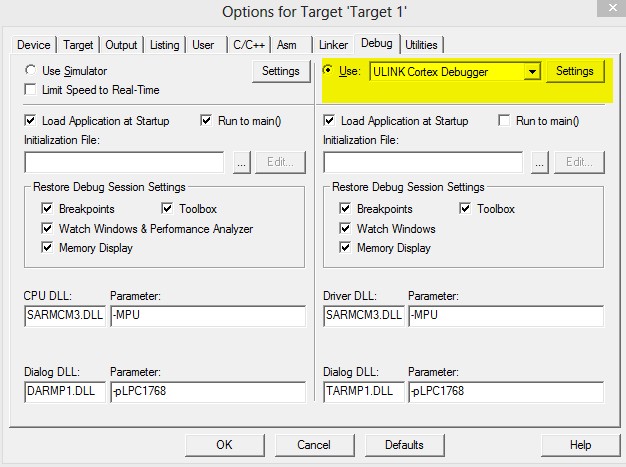
Selecting the Debugger
- Go to Projects -> Options for Target (ALT + F7)
- Click on the Debug Tab
- By default, simulator will be selected. Change it to ULINK Cortex Debugger. Or whatever else you're using
- Click on OK.
Using the Debugger
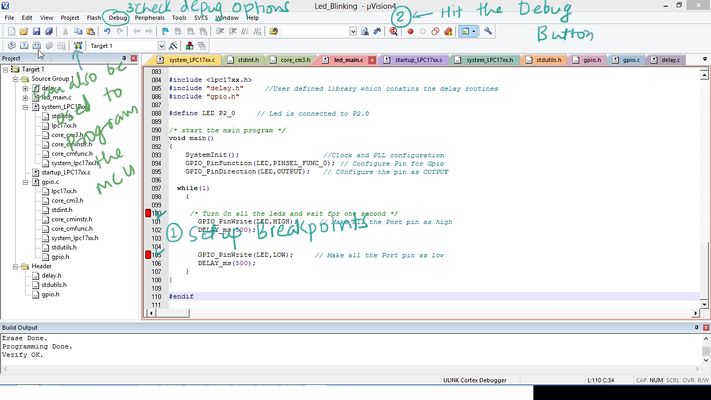
- As said earlier you can use the debugger to upload the firmware to the MCU with the "Upload" button
- Then you ideally set the break points wherever you need them
- Start the debugger
- Use various options from the 'Debug' menu to step into the code.


